US Immigration Statistics and Trends: A Comprehensive Analysis for 2025
US Immigration Statistics and Trends: A Comprehensive Analysis for 2025
Visual representation of key immigration trends and statistics in the United States for 2025
Introduction: Understanding US Immigration in 2025
Immigration continues to be a cornerstone of American society and economy. This comprehensive analysis examines the latest statistics, trends, and impacts of immigration in the United States, providing valuable insights for researchers, policy makers, visa applicants, and anyone interested in understanding the evolving landscape of US immigration.
Drawing from official government data, academic research, and industry reports, this article presents an objective, data-driven overview of immigration patterns, visa approval rates, demographic shifts, and economic contributions of immigrants in the United States as of 2025.
Current Immigration Statistics: By the Numbers
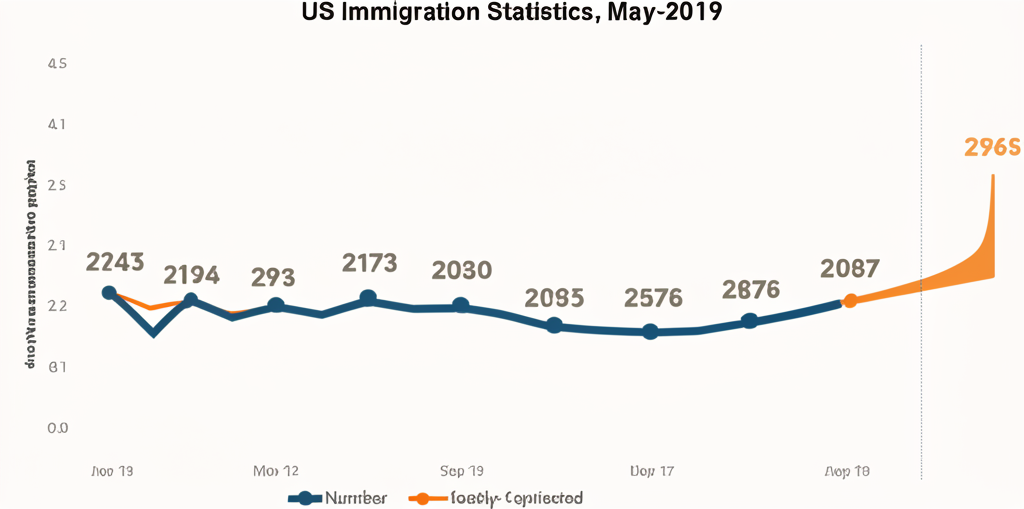
Annual immigration flows to the United States over the past decade show changing patterns
The latest data from the Department of Homeland Security (DHS) and the U.S. Citizenship and Immigration Services (USCIS) reveals several key metrics about immigration to the United States:
Legal Permanent Residents (Green Cards)
- Annual Issuance: Approximately 1.1 million green cards issued annually
- Family-Based: 65% of green cards issued through family relationships
- Employment-Based: 14% issued through employment categories
- Diversity Visa Program: 5% through the diversity visa lottery
- Refugees and Asylees: 15% to refugees, asylees, and other humanitarian cases
- Processing Times: Average processing time of 12-18 months, varying by category
Temporary Visas
- Tourist and Business (B1/B2): 6.8 million visas issued annually
- Student Visas (F and M): 425,000 visas issued annually
- Work Visas:
- H-1B (Specialty Occupations): 85,000 cap plus exemptions
- L-1 (Intracompany Transfers): 75,000 annually
- O-1 (Extraordinary Ability): 18,000 annually
- Exchange Visitors (J-1): 350,000 annually
- Seasonal Workers (H-2A/H-2B): 350,000 combined annually
Visa Approval Rates
Visa approval rates vary significantly by category and applicant nationality:

Visa approval rates by category and region of origin for fiscal year 2024
| Visa Category | Overall Approval Rate | Highest Approval Region | Lowest Approval Region |
|---|---|---|---|
| B1/B2 (Tourist/Business) | 68% | Western Europe (89%) | Sub-Saharan Africa (42%) |
| F-1 (Student) | 82% | East Asia (91%) | Middle East/North Africa (65%) |
| H-1B (Specialty Occupation) | 87% | Western Europe (94%) | South Asia (81%) |
| L-1 (Intracompany Transfer) | 78% | Western Europe (92%) | South Asia (71%) |
| K-1 (Fiancé) | 75% | East Asia (85%) | Middle East/North Africa (58%) |
Note on Approval Rates: Approval rates are influenced by multiple factors including documentation completeness, applicant qualifications, country-specific relationships with the US, and evolving immigration policies. These rates should be viewed as general trends rather than predictors of individual application outcomes.
Demographic Trends: Who Is Immigrating to the US?
The demographic profile of immigrants to the United States continues to evolve:
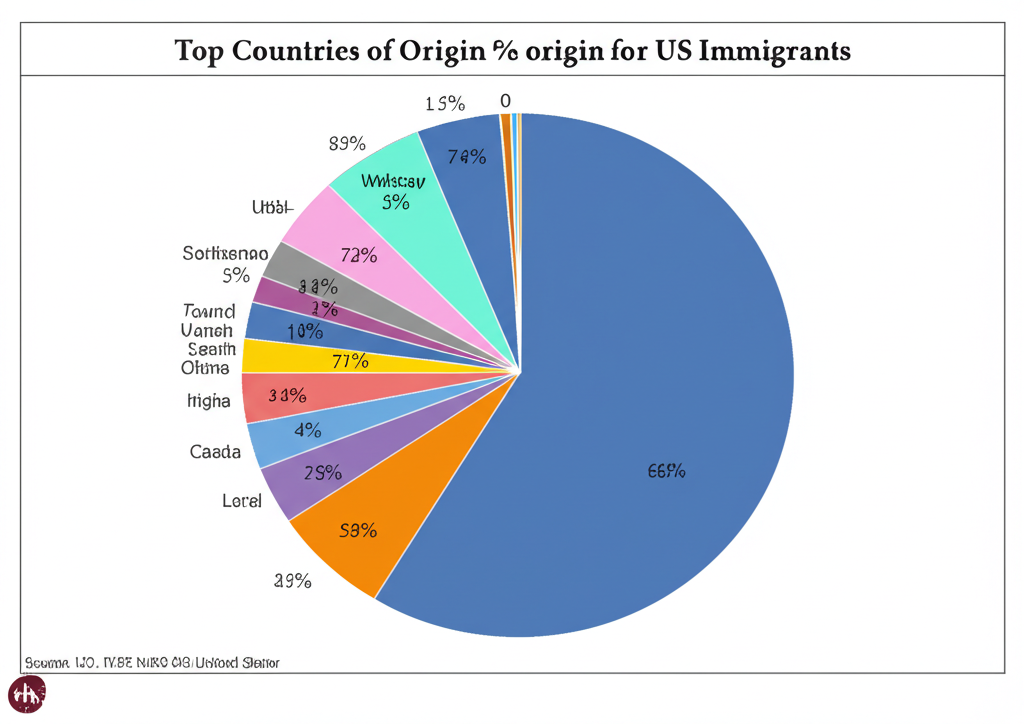
Top countries of origin for immigrants to the United States in 2025
Top Countries of Origin (2025)
- India (18.2%) - Primarily through employment-based visas and family reunification
- China (12.5%) - Significant numbers of students, investors, and skilled workers
- Mexico (10.3%) - Predominantly family-based immigration
- Philippines (6.8%) - Family-based and healthcare professionals
- Vietnam (4.2%) - Family reunification and increasing skilled workers
- Brazil (3.7%) - Growing numbers of investors and skilled professionals
- Nigeria (3.5%) - Increasing educational and professional immigration
- South Korea (3.1%) - Students, professionals, and investors
- Colombia (2.9%) - Growing presence across multiple visa categories
- United Kingdom (2.8%) - Business professionals and specialized workers
Demographic Characteristics
- Age Distribution:
- Median age: 31 years
- Working age (18-64): 78%
- Under 18: 15%
- 65 and older: 7%
- Education Levels:
- Bachelor's degree or higher: 48%
- Some college: 17%
- High school diploma: 23%
- Less than high school: 12%
- Gender Distribution: 52% female, 48% male
- Occupational Sectors: Technology (24%), Healthcare (18%), Business/Finance (14%), Education (9%), Engineering (8%), Other (27%)
Geographic Distribution Within the US
Immigrants continue to settle in traditional gateway states but are increasingly dispersing to new destinations:
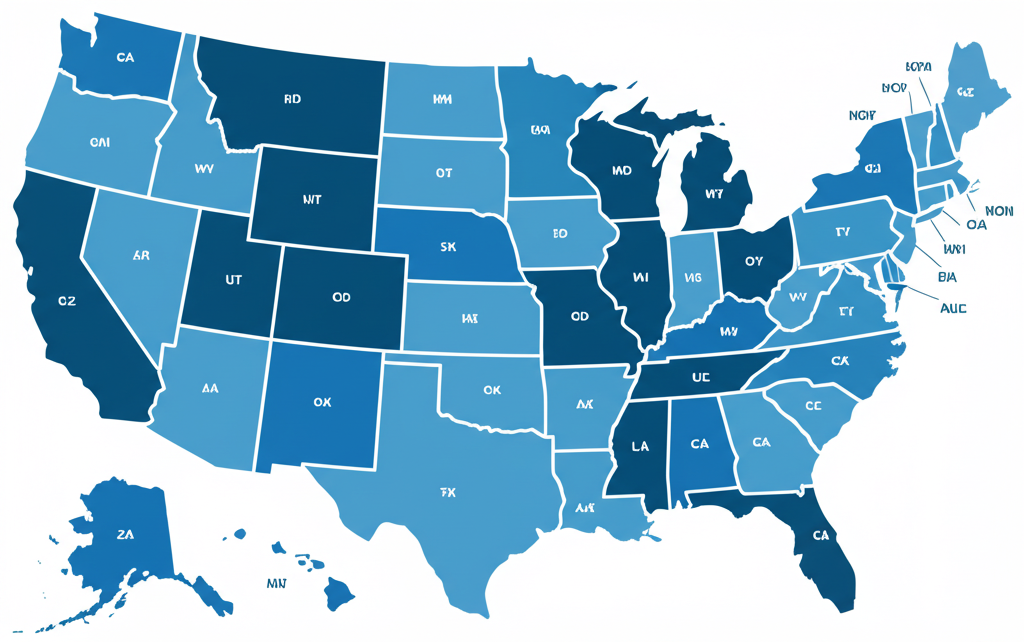
Geographic distribution of immigrant populations across the United States
Traditional Gateway States
- California: 24% of all immigrants
- Texas: 11% of all immigrants
- New York: 10% of all immigrants
- Florida: 9% of all immigrants
- New Jersey: 5% of all immigrants
- Illinois: 4% of all immigrants
Emerging Destination States
- Georgia: Fastest growing immigrant population (32% increase since 2020)
- North Carolina: 28% increase since 2020
- Washington: 26% increase since 2020
- Colorado: 24% increase since 2020
- Tennessee: 22% increase since 2020
- Utah: 21% increase since 2020
Economic Impact of Immigration
Immigration continues to have significant economic impacts on the United States:

Key economic contributions of immigrants to the US economy
Labor Market Contributions
- Immigrants represent 18.2% of the US labor force
- Fill critical gaps in high-skill and low-skill sectors
- 38% of all STEM workers are foreign-born
- 24% of healthcare workers are immigrants
- Contribute to labor force growth as native-born population ages
Entrepreneurship & Innovation
- Immigrants are 80% more likely to start businesses than native-born Americans
- 25% of all new businesses are founded by immigrants
- 55% of billion-dollar startups have at least one immigrant founder
- Foreign-born inventors produce 28% of all patents
- Immigrant-founded businesses employ over 8 million Americans
Fiscal Contributions
- Immigrants contribute approximately $500 billion in taxes annually
- International students contribute $45 billion to the US economy
- Immigrant households have $1.5 trillion in spending power
- Immigrants contribute more to Medicare and Social Security than they receive in benefits
- Second-generation immigrants are among the strongest fiscal contributors
Economic Impact: According to the National Academies of Sciences, Engineering, and Medicine, immigration has an overall positive impact on long-run economic growth in the United States. First-generation immigrants cost governments more than native-born Americans, primarily due to education costs for children, but second-generation immigrants are among the strongest fiscal and economic contributors in the population.
Current Policy Trends and Future Outlook
US immigration policy continues to evolve in response to economic needs, humanitarian concerns, and political considerations:
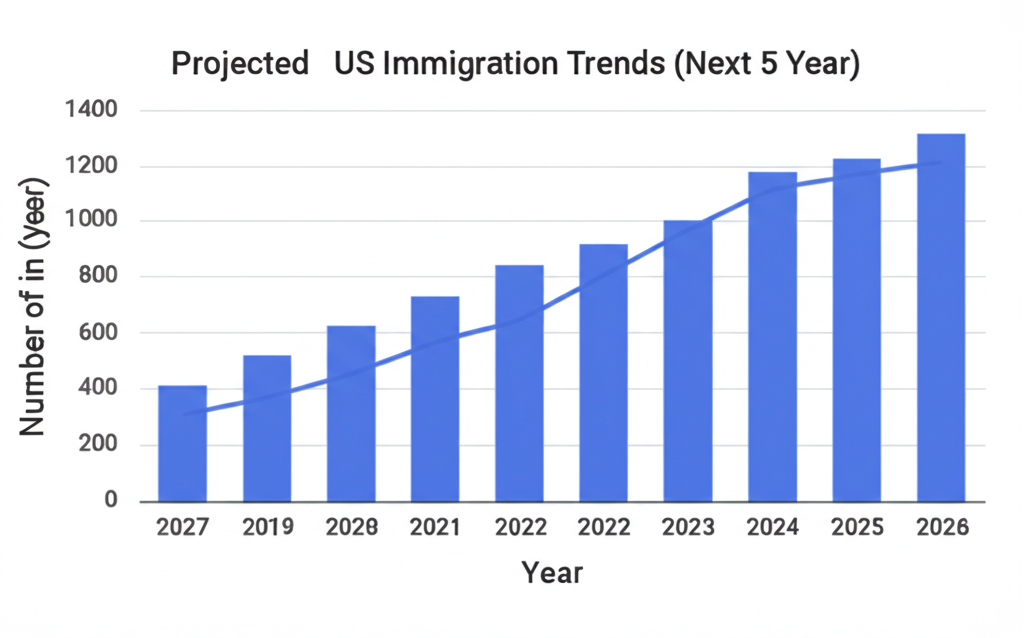
Projected immigration trends based on current policies and global migration patterns
Recent Policy Developments
- Skills-Based Immigration: Increased emphasis on merit and skills-based immigration with expanded pathways for STEM graduates and entrepreneurs
- Processing Modernization: Digital transformation of application processes, reducing backlogs and processing times
- Regional Processing Centers: Establishment of regional centers for asylum processing
- Expanded Work Authorization: Broader work authorization for dependents of certain visa holders
- International Student Policies: Extended post-graduation work opportunities for international students in key fields
Future Outlook (2025-2030)
- Demographic Necessity: Immigration likely to remain crucial as US birth rates decline and population ages
- Global Competition: Increased competition with Canada, Australia, and other nations for global talent
- Climate Migration: Growing influence of climate change on migration patterns
- Technology Impact: Continued evolution of remote work may change some immigration patterns
- Policy Pendulum: Immigration policies likely to continue fluctuating with political changes
Conclusion: The Evolving Landscape of US Immigration
Immigration to the United States continues to be a dynamic and multifaceted phenomenon with far-reaching implications for the nation's demographic makeup, economic vitality, and social fabric. The data presented in this analysis reveals several key trends:
The diverse backgrounds of immigrants continue to enrich American society and culture
Key Findings
- The profile of immigrants to the US is increasingly diverse, educated, and skilled
- Asia has surpassed Latin America as the primary source region for new immigrants
- Immigrants continue to make substantial economic contributions through labor, entrepreneurship, and innovation
- Geographic distribution of immigrants within the US is becoming more dispersed beyond traditional gateway states
- Policy trends reflect a growing recognition of immigration's economic importance, particularly for high-skilled workers
- Approval rates and processing times vary significantly by visa category and applicant nationality
- Future immigration patterns will be shaped by global economic conditions, climate change, and international competition for talent
For individuals navigating the US immigration system, understanding these broader trends and statistics can provide valuable context. However, each immigration case is unique, and success depends on careful preparation, thorough documentation, and adherence to current requirements.
Need Help With Your Immigration Documents?
Our document generation tools can help you create professional documents for your visa application.
Generate Bank Statements Create Invitation LettersLast updated: February 5, 2025 | This analysis reflects the most current US immigration data and trends available.
Need Help With Your Visa Documents?
Our document generation tools can help you create professional visa application documents quickly and accurately.